IBM Data
IBM Data was one of IBM’s key social media touch-points dedicated to communicating ideas around data, AI, and emerging technologies. Through platforms like Instagram, it translated complex technological concepts into accessible stories. The challenge was to communicate topics like data catalogs, data science roles, and quantum computing in a way that felt clear, engaging, and native to Instagram. The work used illustration and visual metaphors to simplify complex concepts into approachable and easy-to-understand narratives.
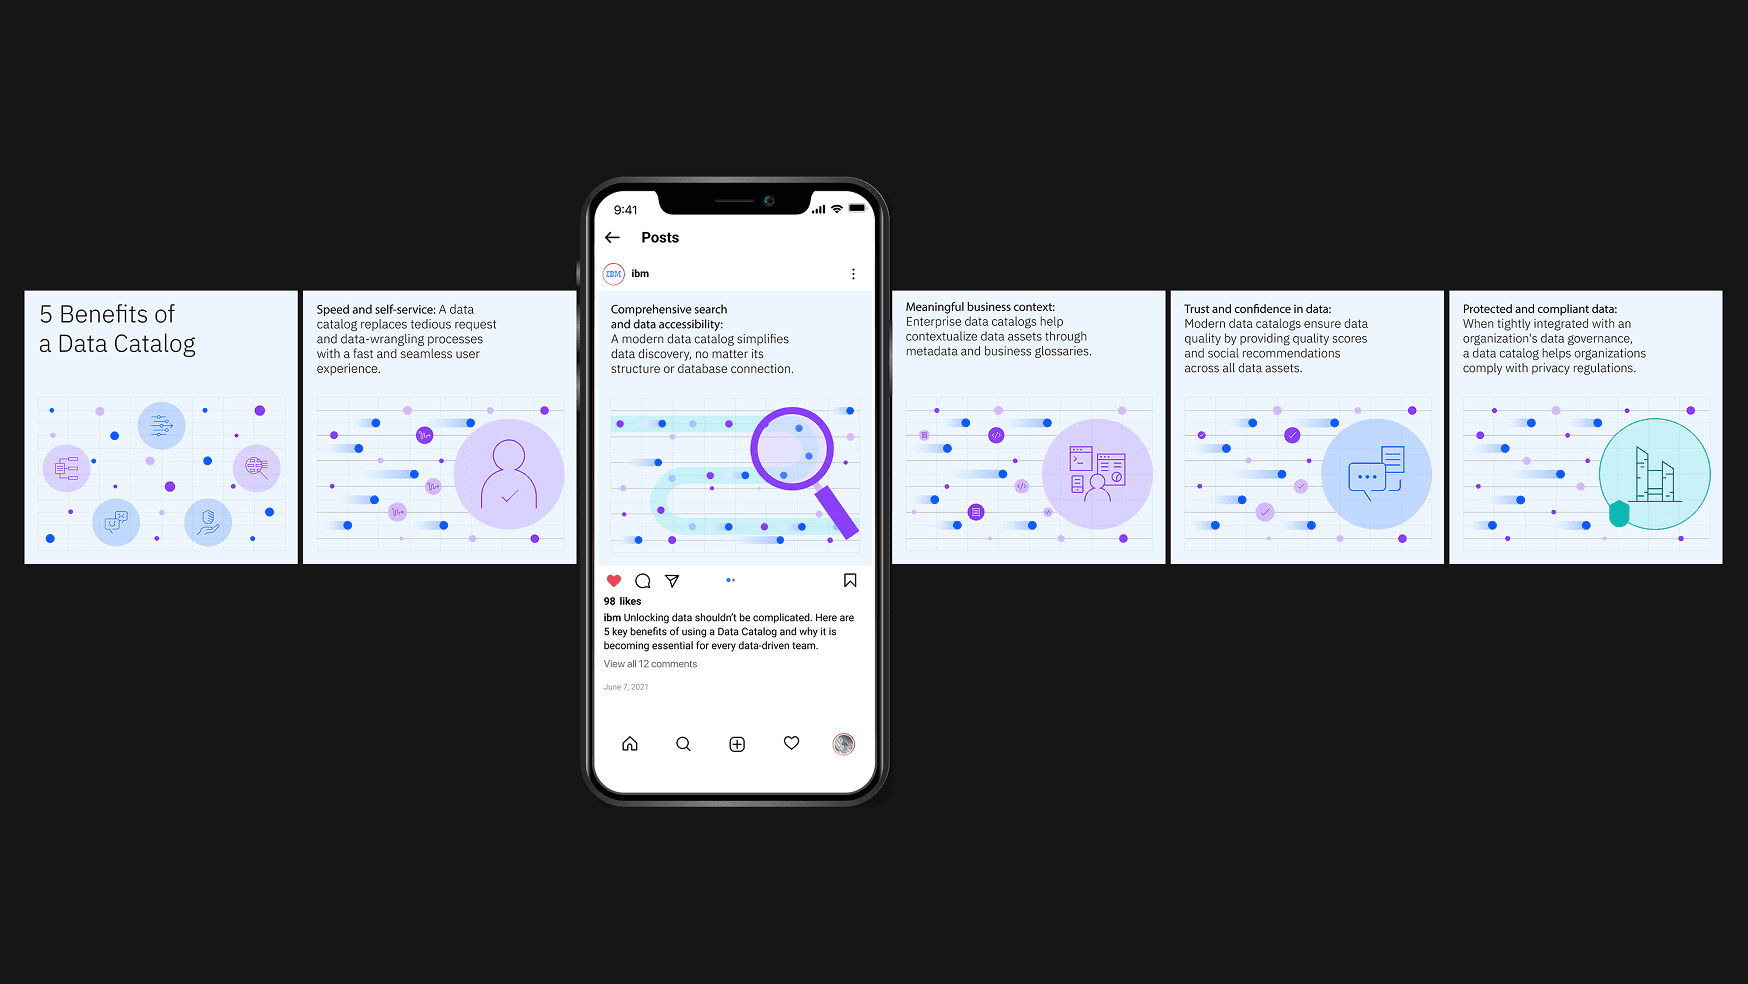
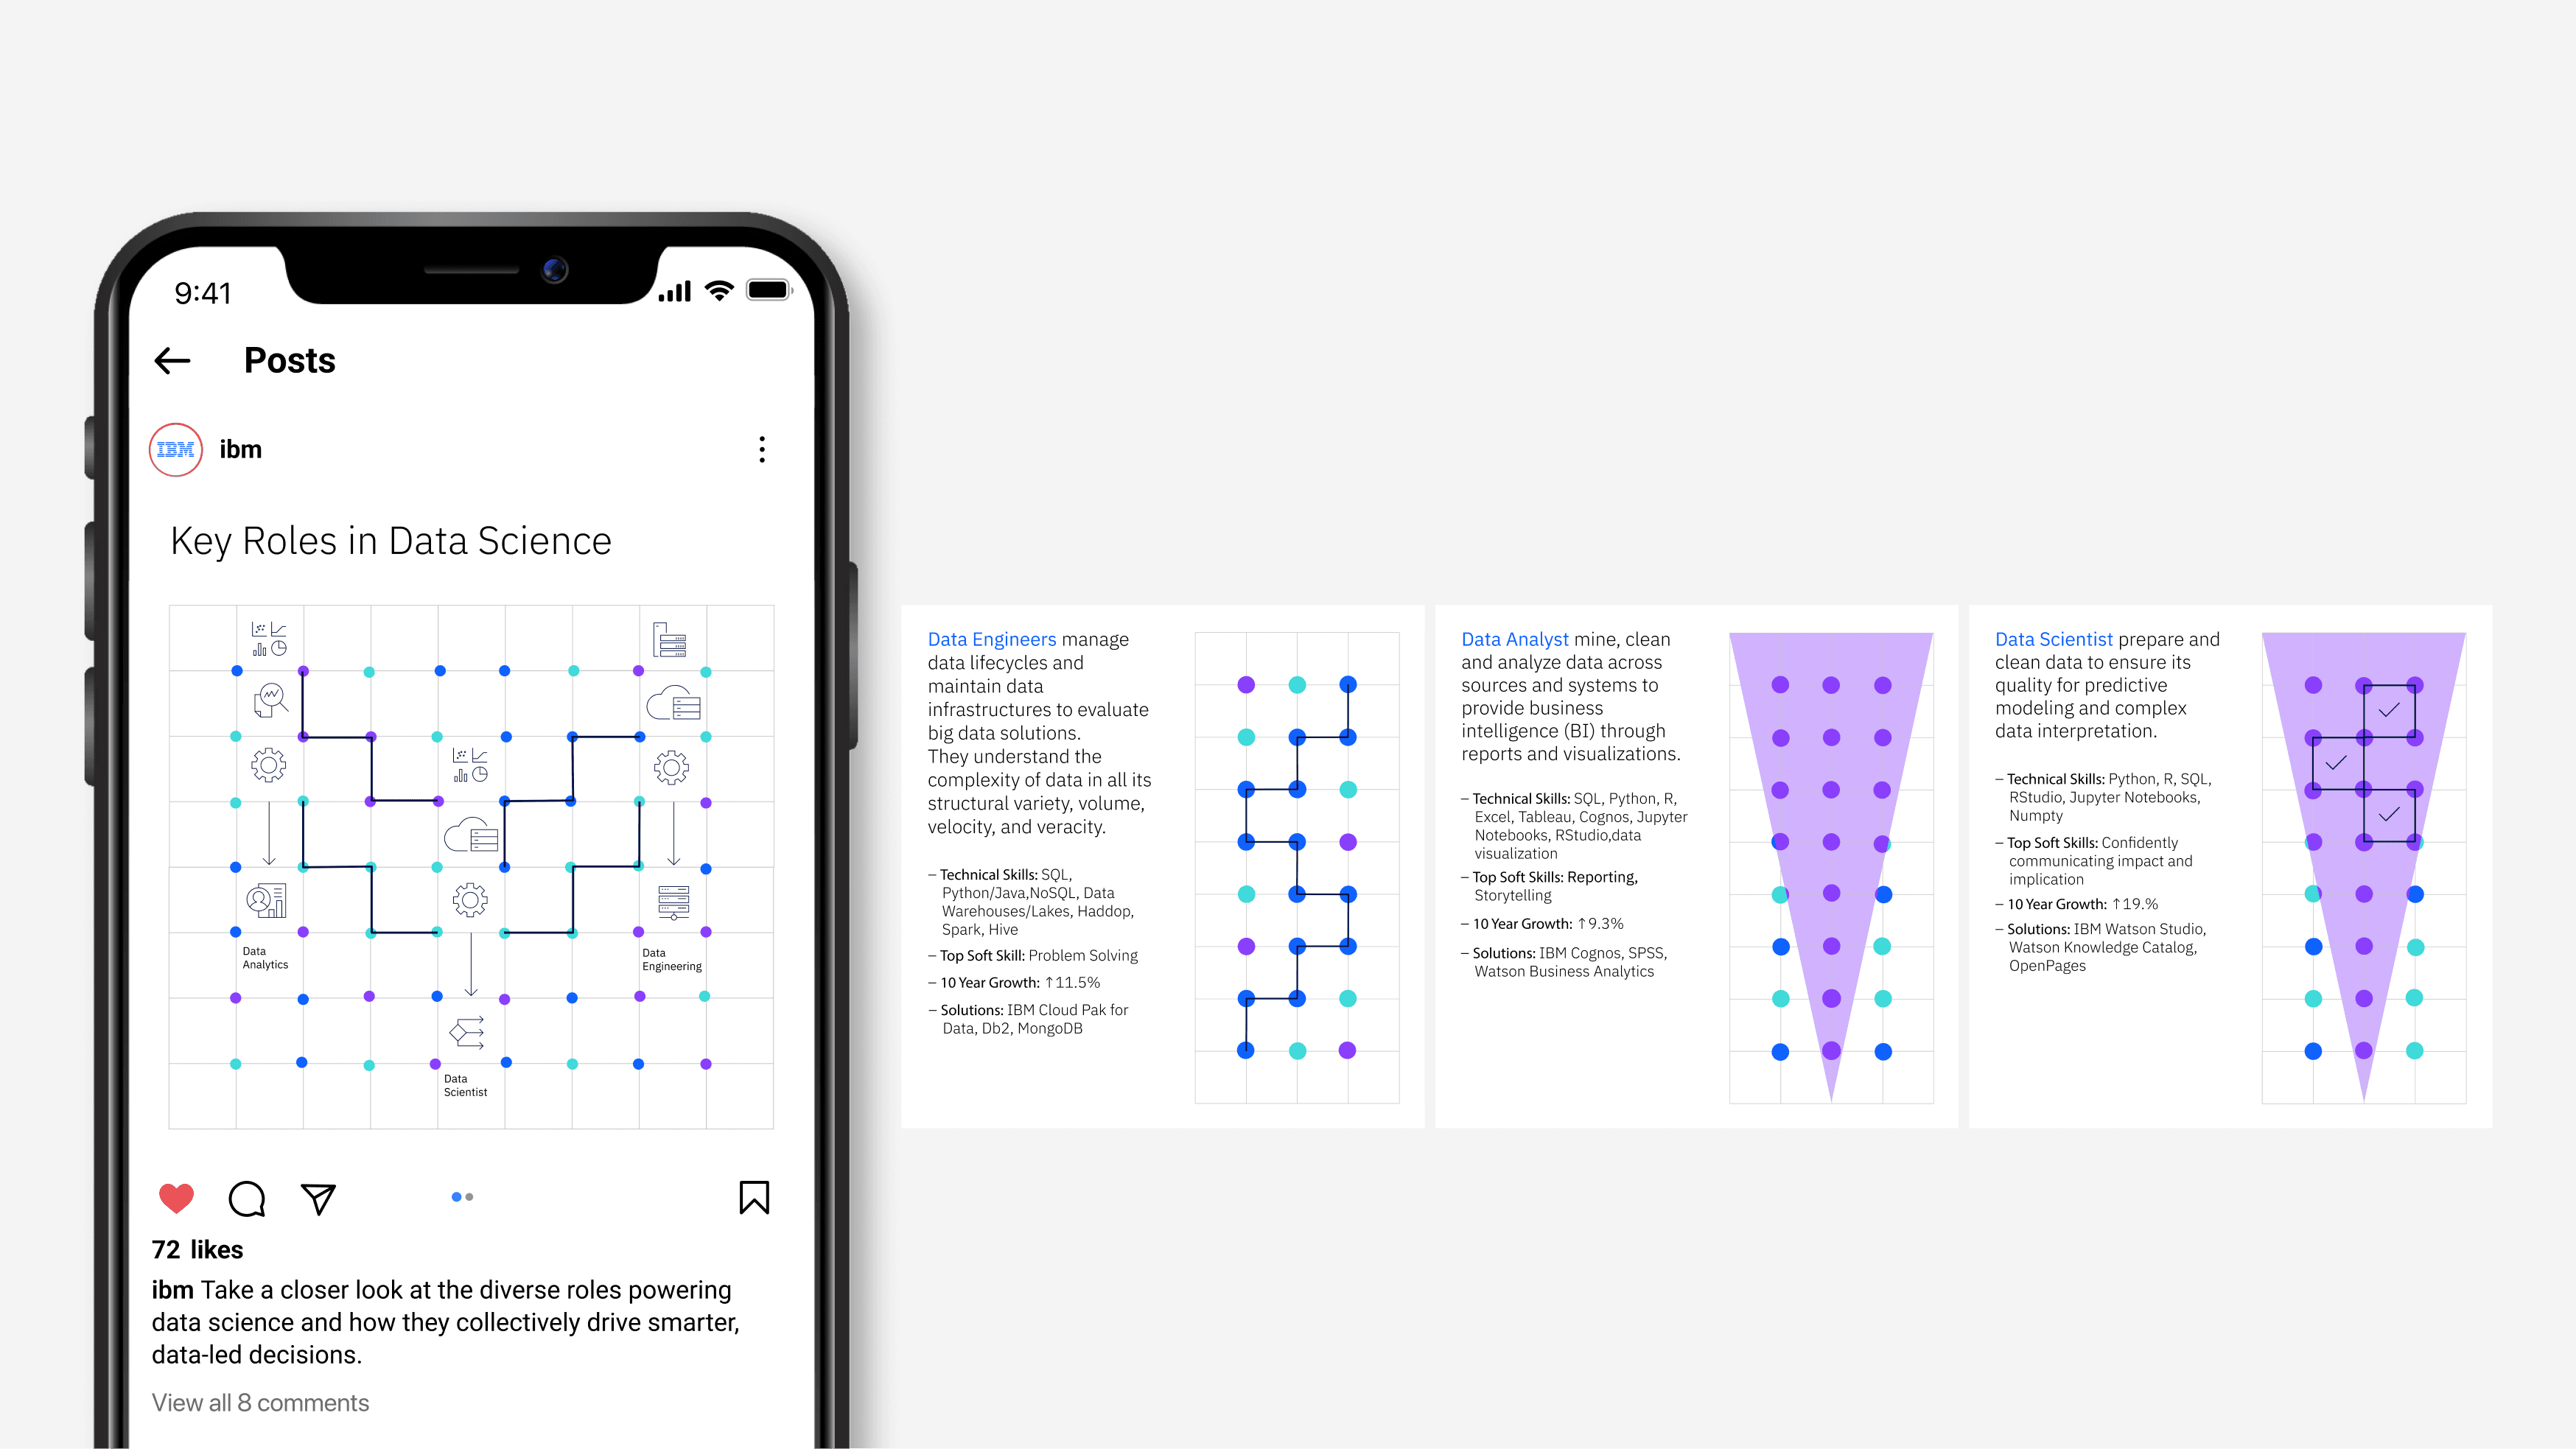
Most data concepts are inherently abstract and invisible, which makes them difficult to communicate in fast-paced social media environments. Our approach focused on visual thinking rather than technical explanation alone. To do this, we used metaphors to translate complex systems into simple, relatable forms. Because the content lived on Instagram and LinkedIn, each carousel was treated as a short visual narrative. We structured them with a strong opening frame, clear hierarchy, and a logical progression that gradually unpacked the idea, helping complex topics feel more approachable.

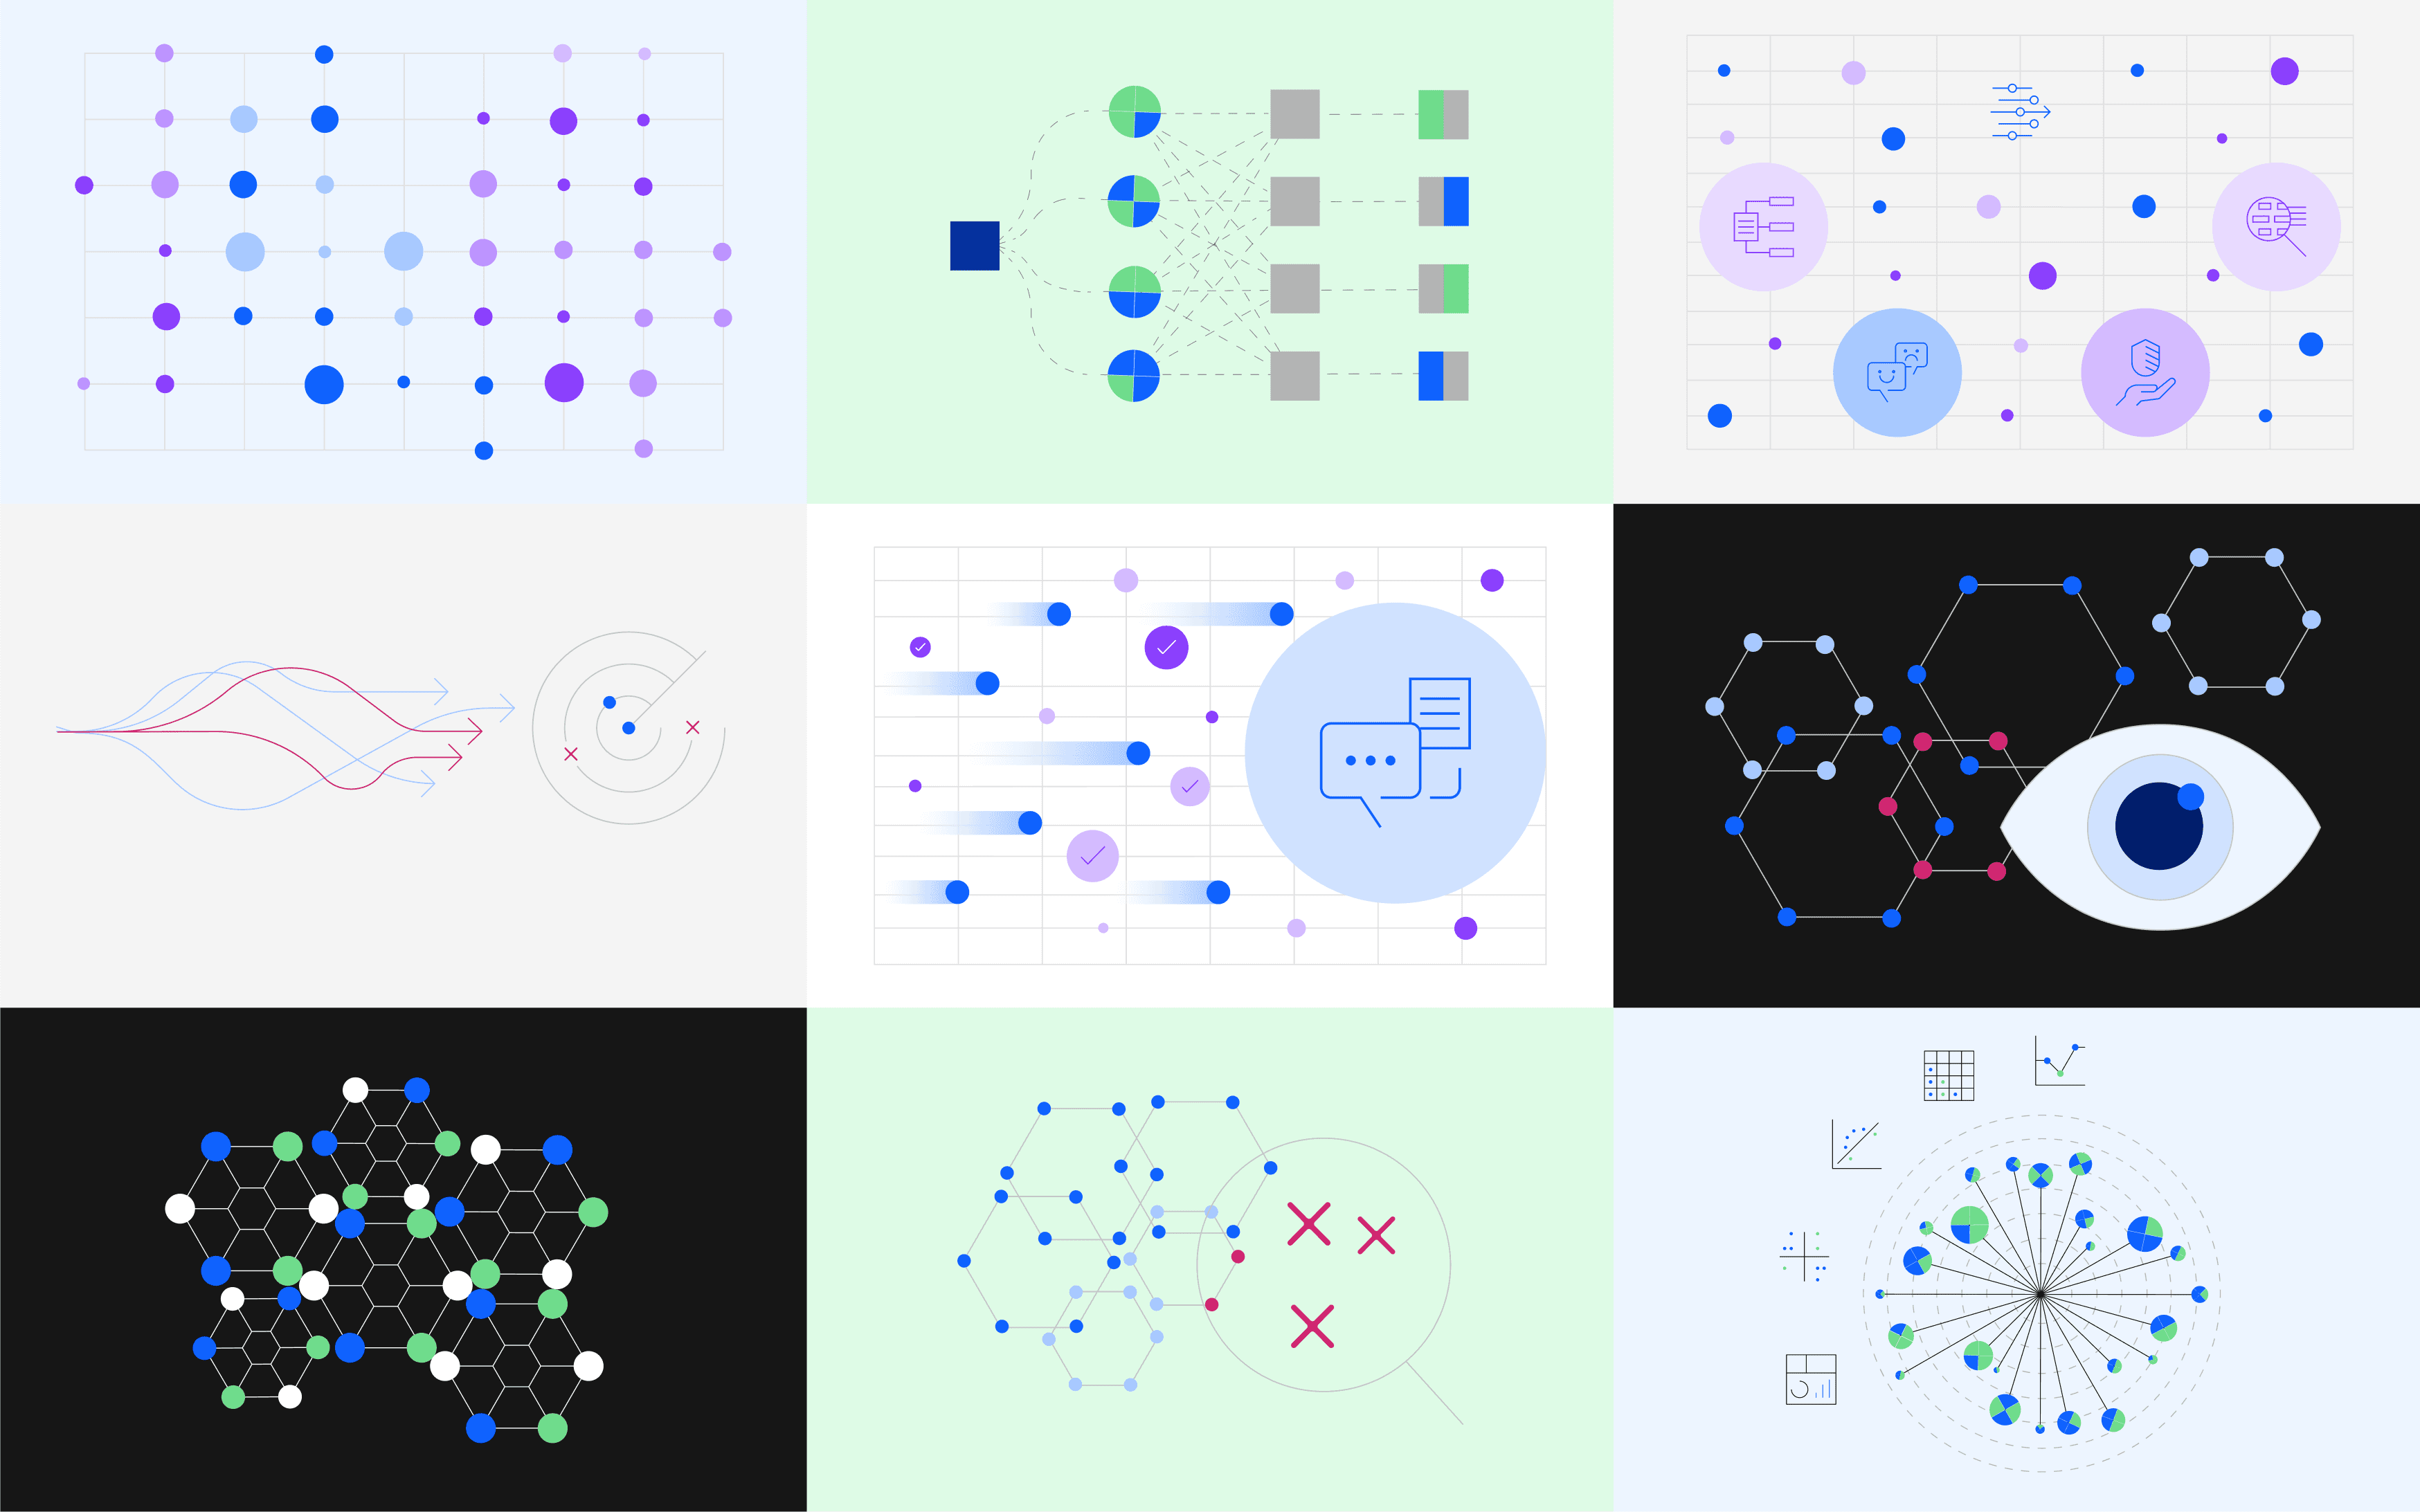
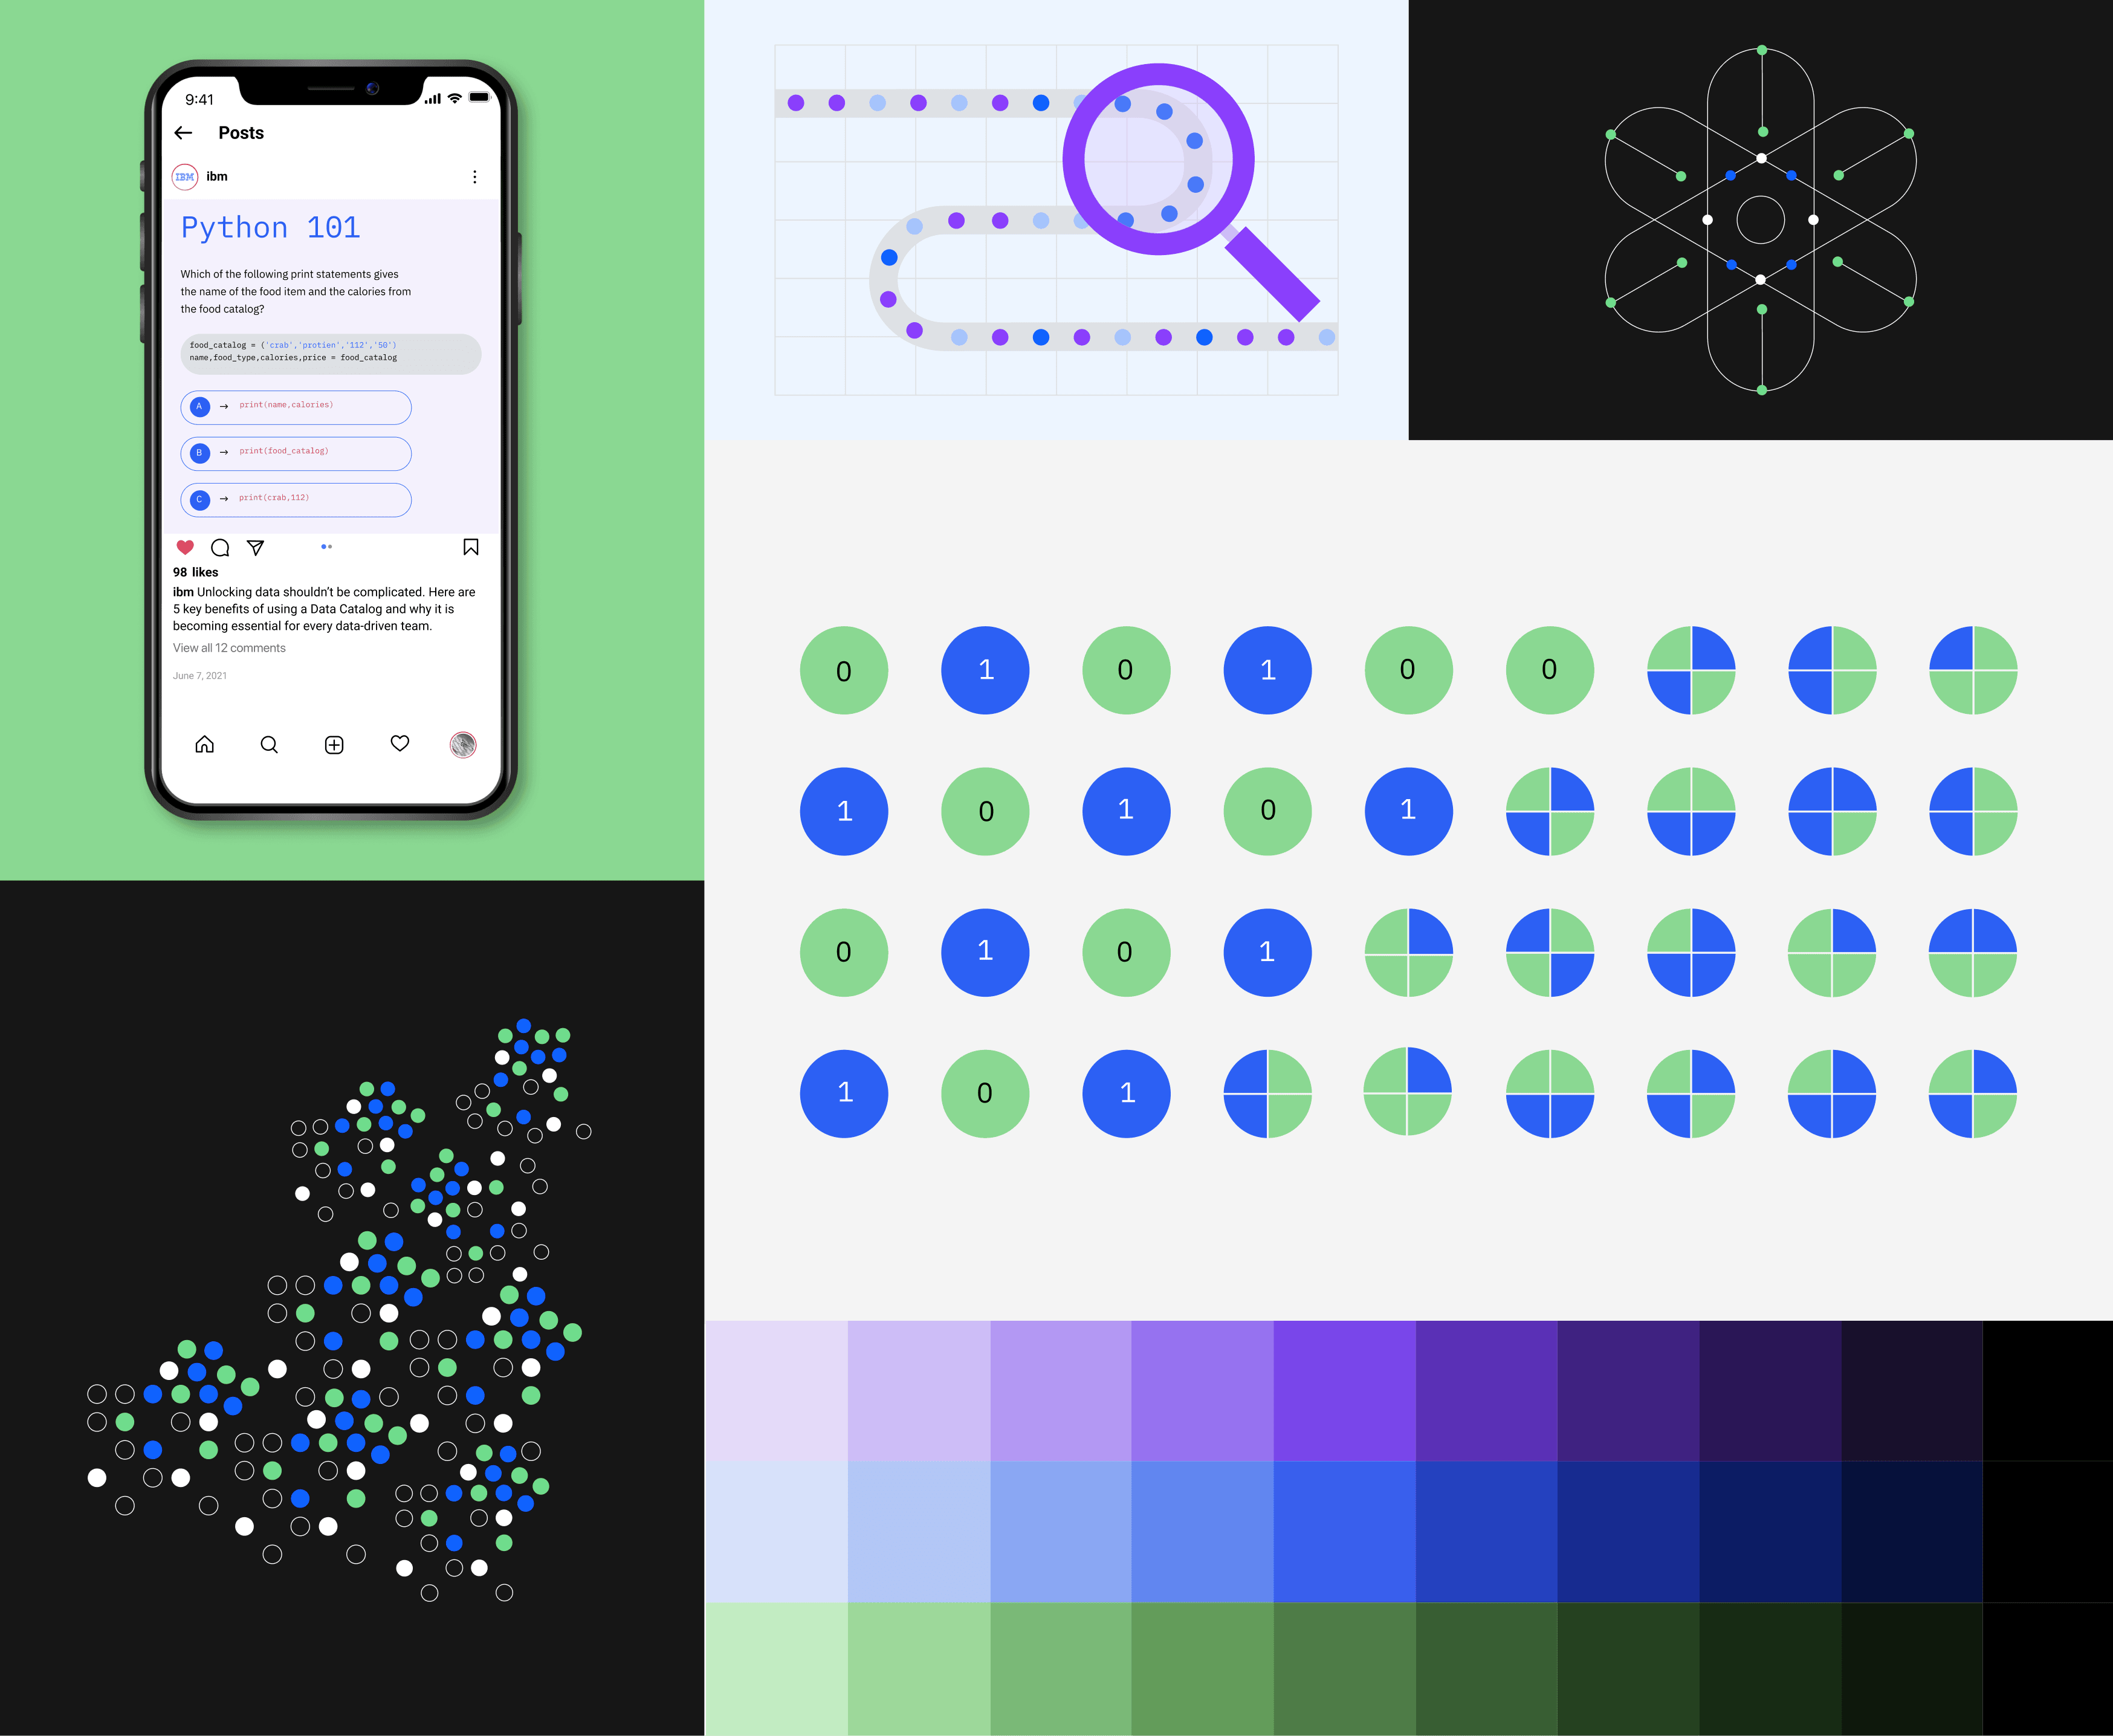
To support the narrative approach, we developed a minimal line + flat illustration style that could communicate complex ideas with clarity. Circles became the primary visual element, often placed within a visible grid across compositions. The simplicity of the style ensured that the concepts remained central rather than getting lost in visual detail. A restrained palette of blues, greens, and purples was used to reference themes of data and technology while keeping the tone calm, modern, and approachable for an enterprise audience.
Team
Shreya Kulkarni
Savitha Shivaram